FAQ
1. What is CryptoBubbles?
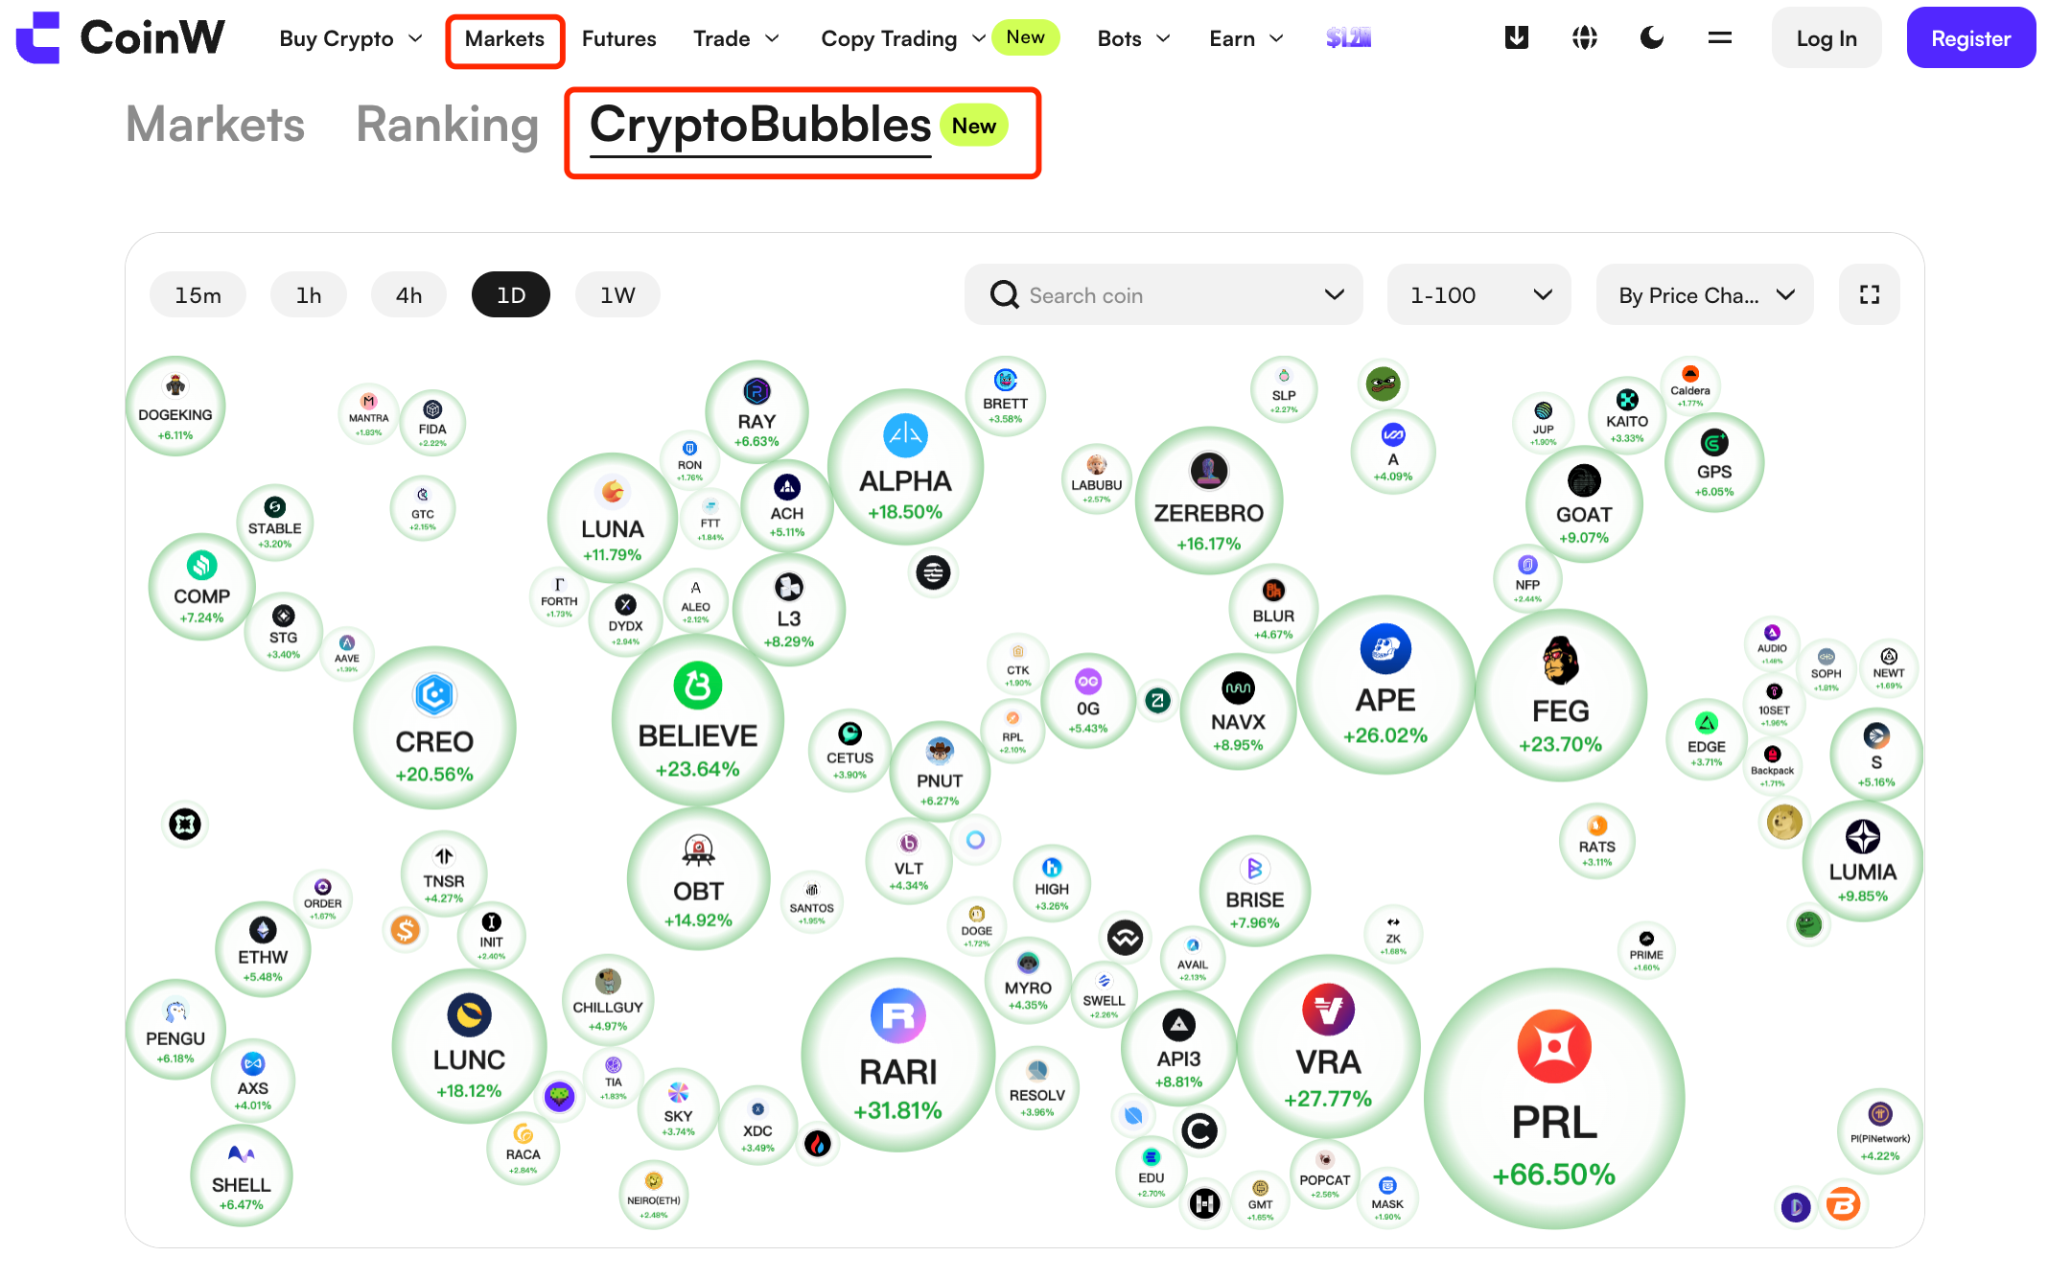
CryptoBubbles displays market data for selected assets in a bubble chart, including price, price change, trading volume, and market capitalization. Each trading pair is represented as a bubble, where color, movement, and interaction reflect its market performance. A data list is also displayed below the chart, showing market data for the selected assets, allowing users to compare and view the information more easily.
2. Advantages of CryptoBubbles
Easy to use: Click “Market” and select “CryptoBubbles” to enter the bubble chart interface. Click any asset to view its price, price change, trading volume, market cap, and price chart.
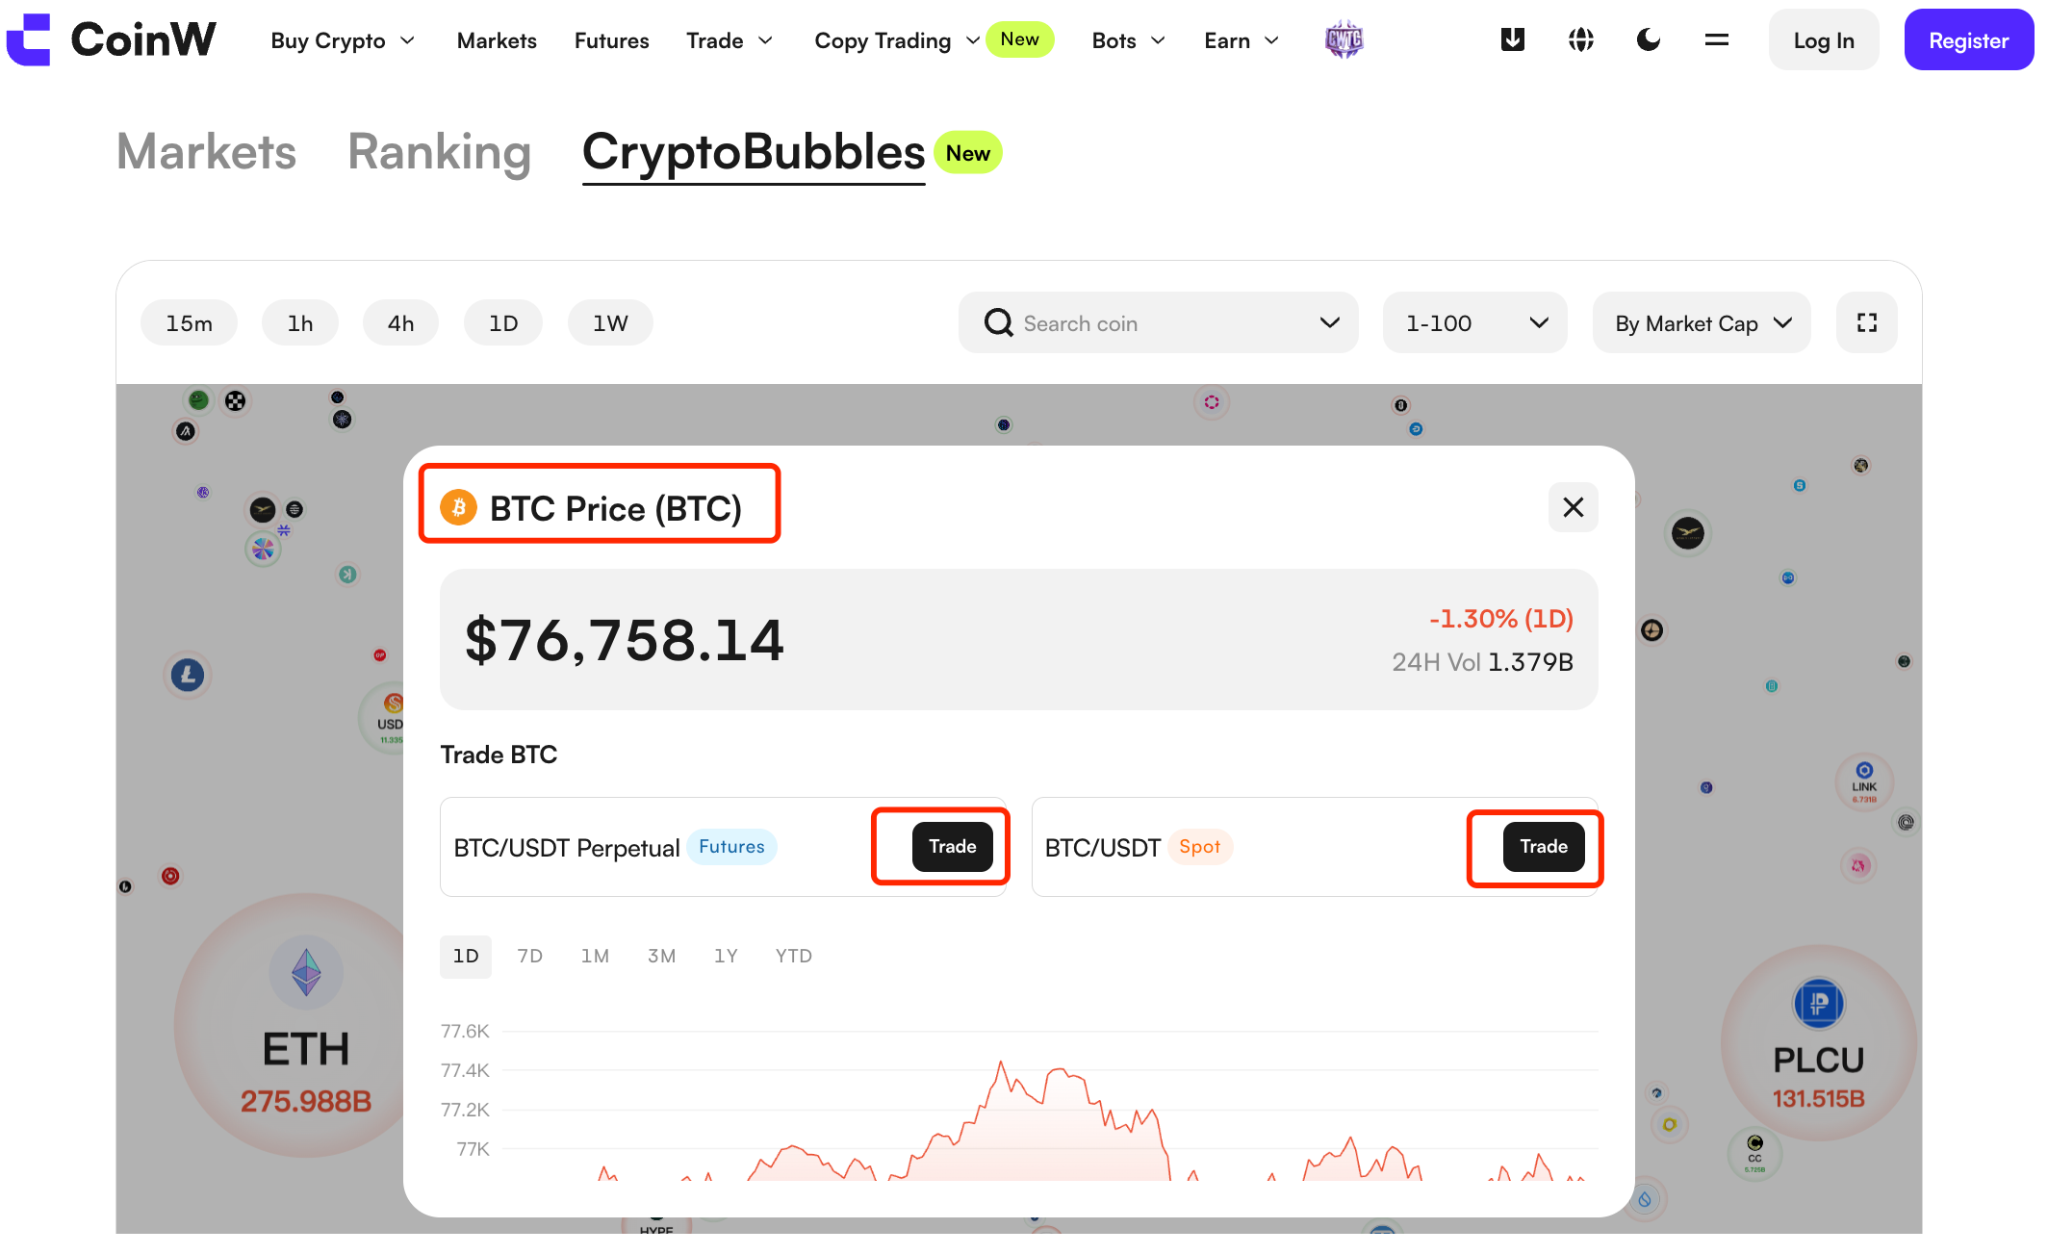
Convenient for viewing and trading: Click an asset to enter spot or futures trading.
Real-time updates: Market data (price, price change, trading volume, and market cap) and bubble movements are recalculated and updated every 30 seconds.
Stronger visual presentation: Compared with traditional list views, dynamic effects such as color, movement, and interaction provide a more intuitive way to view market data.
3. How to Use CryptoBubbles
3.1 Log in to your CoinW account, click “Market”, and select “CryptoBubble” to enter the page.
3.2 On the CryptoBubbles page, click any asset to open the asset details page, where you can view market data and price trends. Click “Spot Trading” or “Futures Trading” to go to the corresponding trading page.
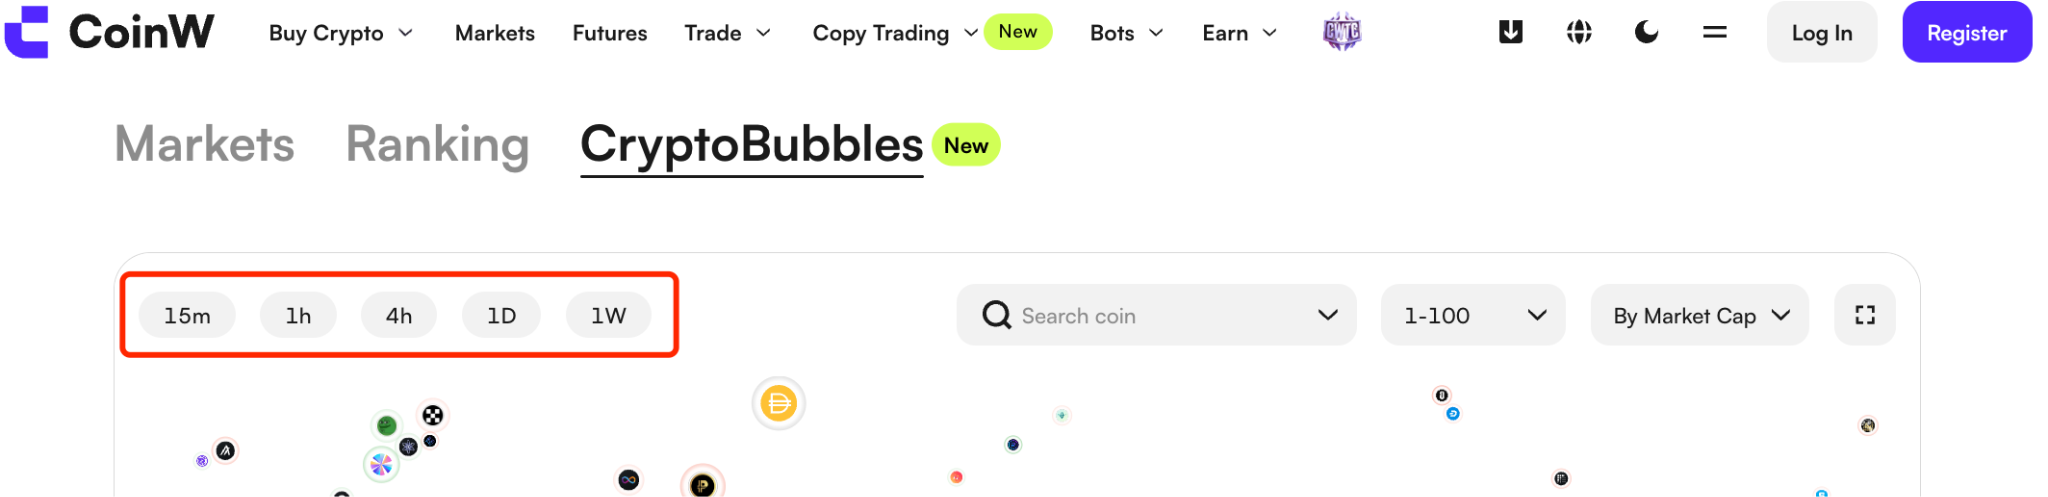
3.3 In the time interval bar at the top of the CryptoBubbles page, select different intervals (15min, 1h, 4h, Day, Week) to switch the bubble chart based on the corresponding price change period. The bubble display and movement will update accordingly.
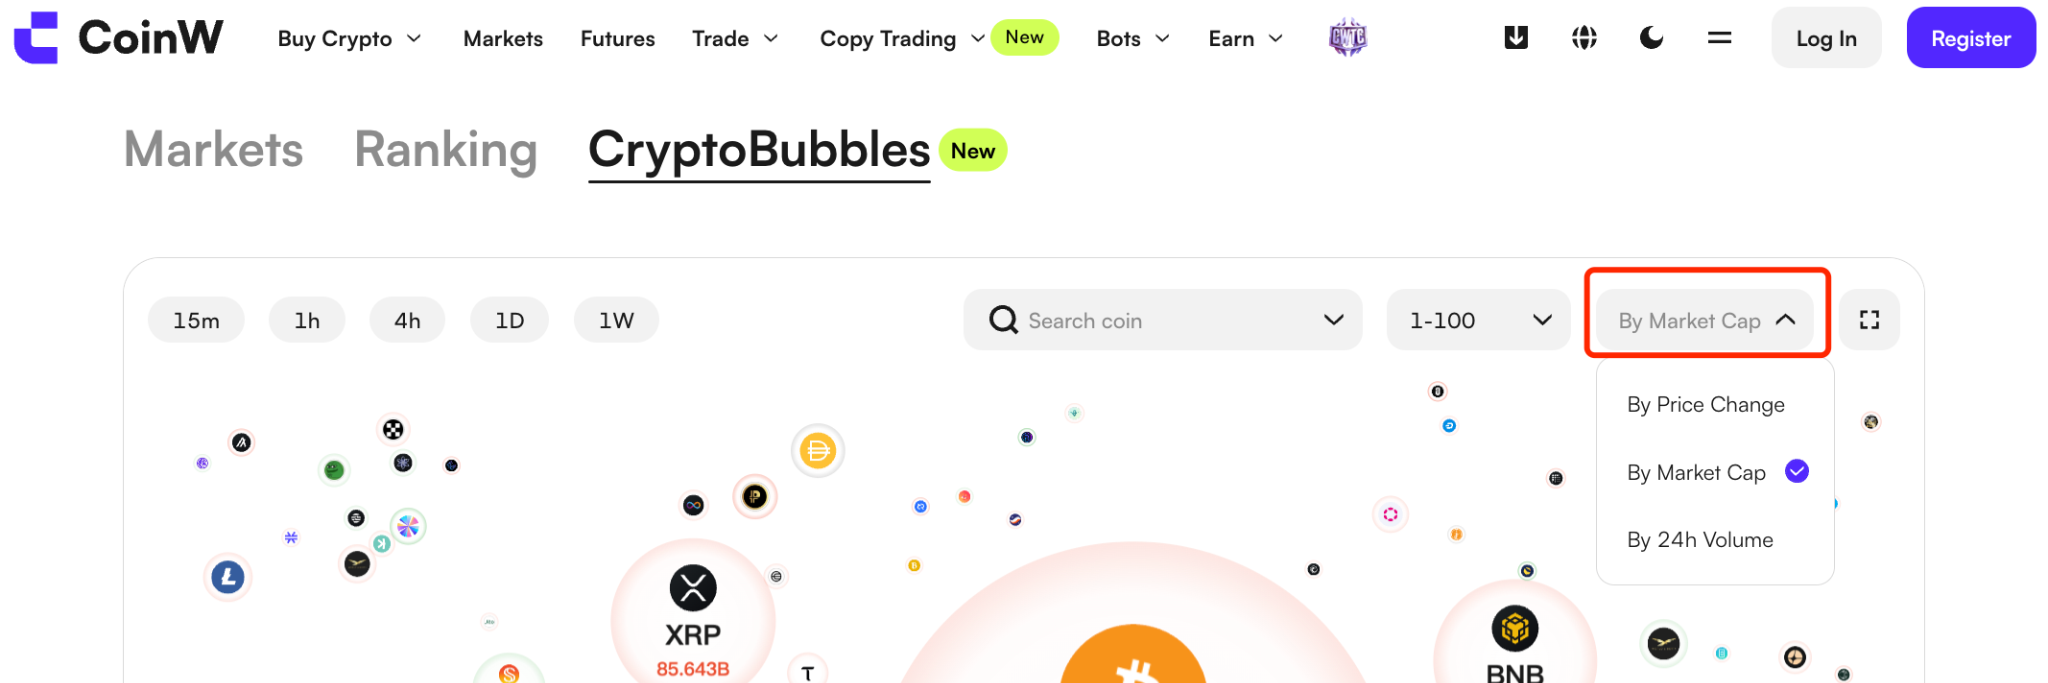
3.4 In the filter bar at the top of the CryptoBubbles page, select “By Market Cap” and switch between different parameters (price change, 24h trading volume, market cap). The bubble display and movement will update based on the selected parameter.
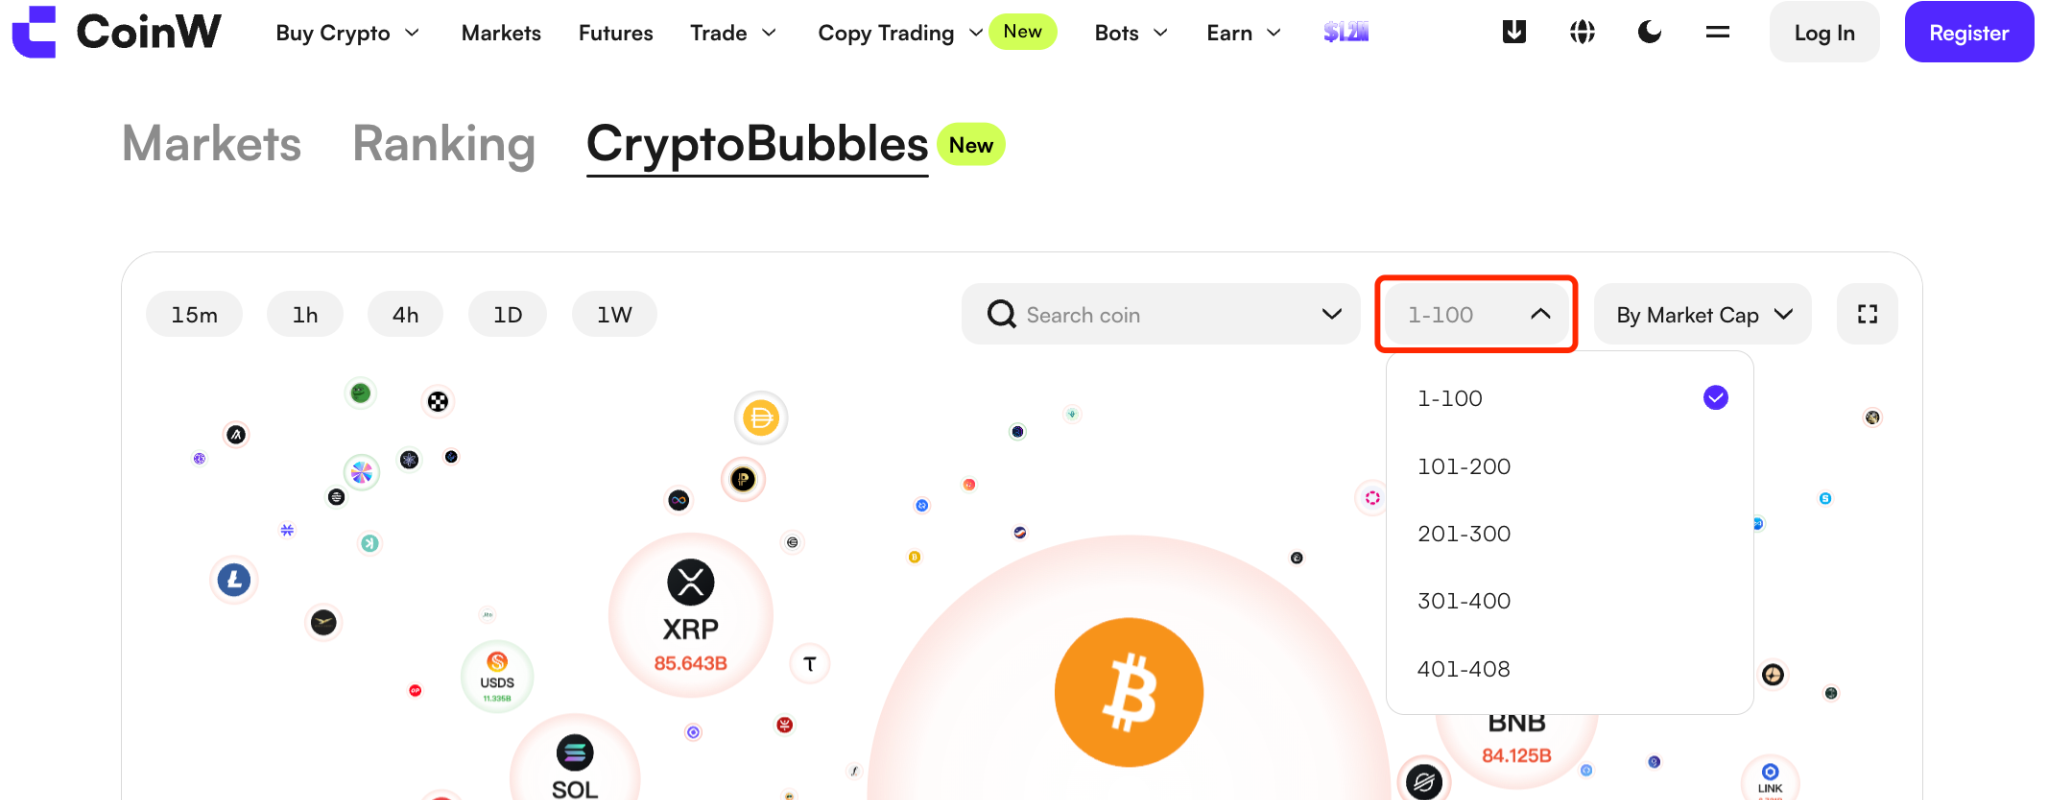
3.5 In the asset range selector at the top of the CryptoBubbles page, select different market cap ranking ranges to display the corresponding assets. The chart will show up to 100 assets within the selected range, along with the bubble view and data list.
3.6 Click the refresh button to recalculate and update the bubble data and movement.
3.7 Click the expand button to enter full-screen mode and view the bubble chart.
4. FAQ
1) When is CryptoBubbles data updated?
Market data (price, price change, trading volume, and market cap) and bubble movements are recalculated and updated every 30 seconds.
2) Where can I access spot or futures trading?
Click any asset to open the asset details window, where you can choose to enter spot or futures trading.
1. What is CryptoBubbles?
CryptoBubbles displays market data for selected assets in a bubble chart, including price, price change, trading volume, and market capitalization. Each trading pair is represented as a bubble, where color, movement, and interaction reflect its market performance. A data list is also displayed below the chart, showing market data for the selected assets, allowing users to compare and view the information more easily.
2. Advantages of CryptoBubbles
Easy to use: Click “Market” and select “CryptoBubbles” to enter the bubble chart interface. Click any asset to view its price, price change, trading volume, market cap, and price chart.
Convenient for viewing and trading: Click an asset to enter spot or futures trading.
Real-time updates: Market data (price, price change, trading volume, and market cap) and bubble movements are recalculated and updated every 30 seconds.
Stronger visual presentation: Compared with traditional list views, dynamic effects such as color, movement, and interaction provide a more intuitive way to view market data.
3. How to Use CryptoBubbles
3.1 Log in to your CoinW account, click “Market”, and select “CryptoBubble” to enter the page.
3.2 On the CryptoBubbles page, click any asset to open the asset details page, where you can view market data and price trends. Click “Spot Trading” or “Futures Trading” to go to the corresponding trading page.
3.3 In the time interval bar at the top of the CryptoBubbles page, select different intervals (15min, 1h, 4h, Day, Week) to switch the bubble chart based on the corresponding price change period. The bubble display and movement will update accordingly.
3.4 In the filter bar at the top of the CryptoBubbles page, select “By Market Cap” and switch between different parameters (price change, 24h trading volume, market cap). The bubble display and movement will update based on the selected parameter.
3.5 In the asset range selector at the top of the CryptoBubbles page, select different market cap ranking ranges to display the corresponding assets. The chart will show up to 100 assets within the selected range, along with the bubble view and data list.
3.6 Click the refresh button to recalculate and update the bubble data and movement.
3.7 Click the expand button to enter full-screen mode and view the bubble chart.
4. FAQ
1) When is CryptoBubbles data updated?
Market data (price, price change, trading volume, and market cap) and bubble movements are recalculated and updated every 30 seconds.
2) Where can I access spot or futures trading?
Click any asset to open the asset details window, where you can choose to enter spot or futures trading.